
I wanted to discuss my favorite long term market valuation indicator, which we will call equity allocation of investors. What does that mean? Well, in short, of all the wealth and assets to which people can allocate their capital, it represents the fraction that is allocated to equities. The idea is simple – when investors have a large fraction of their wealth allocated to equities, long-term future returns will be lower, because investors have bid up the price in seeking to allocate more towards equities, while the reverse is true when investors have allocated very little to equities. Values for this measure have historically ranged from a low of just under 22% to a high of almost 52%.
Now, it should be said that it is impossible to predict short-term market returns. If you could do that, there are many ways you could use that information to become fabulously wealthy in a relatively short period of time. However, no model can do that because it would need to be able to predict things like coming wars, inflation shocks, housing crashes, political events, etc., before they happen. Such a mathematical model would need to simulate the entire world of human events and that just isn’t possible. It is really a fool’s errand to try. However, over sufficiently long time periods, such events tend not to be catastrophic to the continued functioning of the US market no matter what they are, and become relatively less important over time. Stocks continue to make money and investor sentiment matters less over the long term as profits and returns outweigh everything. As Benjamin Graham liked to say, “in the short run, the market is a voting machine, but in the long run it is a weighing machine.”
Over short time periods, all valuation measures have low correlation with market returns, but when looked at over long time periods of about 10 years, correlations with valuation measures can become decent. One favorite measure is the Cyclically adjusted P/E ratio (CAPE ratio or Shiller P/E), popularized by the economics Nobel Prize winner Robert Shiller. The CAPE ratio is found by averaging market P/E over a 10 year period (about 1 business cycle). Robert Shiller publishes the CAPE ratio and other historical stock data here. This measure has about a -0.79 R2 correlation coefficient with future 10 year returns of the market currently. A value of 1 would mean perfectly correlated and 0 would mean no correlation. The negative sign just means they are well correlated but move in the opposite direction – that is, when CAPE is high, future returns are low, and when CAPE is low, future returns are high. -0.79 is pretty decent. The CAPE ratio can then be used to make a reasonable prediction on future market returns.
Now let’s look the equity allocation of investors. This measure is published by the Federal Reserve Bank of St. Louis in this data which is a calculated measure derived from several series of data available through them. In contrast to the CAPE ratio which has an overt valuation component (price to earnings averaged over a 10 year time period), the equity allocation of investors does not have valuation explicitly present. However, if you look a little deeper it does account for valuation.
Imagine an extreme hypothetical situation in which you have a high returning, high growth asset (stocks) and a few very low returning, low growth assets (cash, bonds, real estate). The high returning asset produces lots of returns for investors that must be re-invested into one of the 4 asset classes. If the returns are reinvested in cash, bonds and/or real estate, they get bid up and their returns become even worse while the valuation of the stock market becomes even better relative to its returns. Only if even more is reinvested into stocks could the valuation keep pace with growth. This means that in this scenario, eventually the entire universe of investable assets would be an extremely large allocation to stocks and extremely small allocations to bonds, cash and real estate. The prices of the bonds, real estate, and cash would have to fall in order for transactions to take place. And they would fall to a level where the valuation would then be attractive. If this situation persisted, the equity allocation of investors would approach 100% allocation to stocks over time. This makes sense, because if the stock market were growing significantly faster than everything else, it must eventually become close to 100% of all investable assets through the power of compounding returns absent some correction that occurs to change this trajectory. Therefore, even though the equity allocation of investors is not explicitly including valuation measures, by its very nature, it encompasses information about valuation. For a more in depth theoretical discussion of the equity allocation of investors and why it works, you can refer to this blog post by Philosophical Economics the originator of this measure as a useful indicator of future market returns.
The equity allocation of investors does even better than the next best measure we know of (CAPE mentioned above) in predicting long-term market returns. Equity allocation of investors is correlated with future 10 year annualized returns in the market with a correlation coefficient of -0.90 R2! This is a fantastic correlation and without explicitly including any valuation measures. It only looks at what investors have allocated to the stock market vs. everything else. Figure 1 below shows a model which uses equity allocation of investors to predict future 10 year market returns in the S&P500 (red line), along with the actual 10 year market returns (blue line). The green line is predicted 10 year market returns for the time periods which don’t yet have 10 years in them, so we will need to wait and see what the future brings.
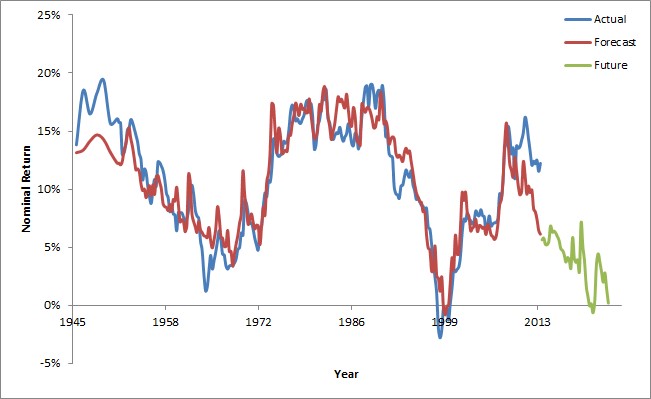
For this model, the linear regression fit is:
10 year annualized total S&P 500 return = 0.334 – 0.663 * EAI
where EAI = Equity Allocation of Investors
It is important to note a couple of things. This model predicts nominal returns, not real inflation adjusted returns, because there is no accounting for or adjustment for inflationary mechanisms in this model. Further, this model predicts total return of the S&P 500. That isn’t just the change in quoted prices of the S&P500 index, but also includes any dividends paid out by the underlying stocks in the index. This is good because it is total return that you actually earn when you invest in the S&P500 index fund, for example. This model predicts the annualized return that each year will average in that 10 year period. That is, despite individual years, jumping around in return quite a bit (remember individual years cannot be well-predicted), they should all average out close to this annualized amount when combined. Keep in mind here that in reality there is some error associated with the model also, even if it is mostly accurate most of the time.
Based on currently available data the model is predicting approximately 0.2% nominal annualized total return over the next 10 years, which isn’t great. There are very few periods when the predicted return was this low. This prediction only went below 0% returns twice ever, once in 1999/2000 during the dot com bust, and once in 2021 after the Covid run up in the market. We have yet to see what will happen for the 2021 time period, since we will have to wait until 2031 to see what the actual 10 year return was. But for the year 2000 prediction, the market did dip into negative returns over the period 1999-2009 and also for the years 2000-2010 for the first time since this data for equity allocation of investors became available.
Now, it should be said that this data cannot be used really to time the market, nor should you try. There are always attractive companies in which to invest, even in times of overvaluation, and you should be developing a Star List of companies to track and purchase the best values on that list all the time – that should be your goal. However, where this data may become useful is in planning for retirement, and perhaps in limited cases for rebalancing into bonds or international stocks. If you are planning on retirement and have saved just barely enough to generate the income you will need, it is probably good to hold off and save some more in periods of low market returns if you will depend on the stock market to grow your nest egg in retirement. Just how much you will need for retirement was discussed a bit in a recent post here.
If US treasury bonds are yielding more than the future returns on stocks, you might consider increasing allocations to treasury bond funds and decreasing your weighting to stock index funds in your 401k, for example. However, this is best left alone in most cases, or at most, if you were planning on rebalancing back to bonds anyway, to do so. If you must, I would only use the extreme cases where this measure is predicting very low or very high returns to change allocations in US stocks vs. international and/or bonds to rebalance between asset classes. Even though this model is quite accurate and tracks closely more often than not, there have been times where returns have deviated by up to +/-6% from the model prediction so that is quite a level of uncertainty still. This blogger has a model that tracks some of the probable outcomes and confidence intervals for future market returns based on this measure.
Further, being panicked about a market crash does you no good either. This model says nothing about the trajectory of those returns over that 10 year period. If the model is predicting 0% return and assuming it is accurate for that 10 year period, the market could be flat in all 10 years, it could have a major crash and then a huge runup, or it could have a major runup and then a huge crash. Normal rebalancing would still let you capitalize somewhat on these scenarios without panicking and selling all stocks and going to 100% cash or bonds.
I plan to explore using this measure to improve upon the Trinity study for determining maximum safe withdrawal rates in retirement in a future post. I will also track this measure periodically for interest. It can be a useful long-term planning tool, but keep in mind, that there are always deals to be had in any market environment, so don’t let this measure scare you away from stocks when it is low.
Leave a Reply