
Previously, we looked at the income statement and the cash flow statement. Using these tools, we looked at the kinds of measures we want to see in an outstanding company for addition to our star list for investing. We will continue this exploration with the balance sheet, and again we will use the Coca Cola Company, as an example case.
The balance sheet is a little bit different than the cash flow statement or the income statement. The cash flows and income statement are usually describing some short span of time (such as a quarter or a year). However, the balance sheet describes the current state of the company based on the cumulative effects of all of the decisions that the company has made over its lifetime. If it decided to take out a large debt 10 years ago, that will still be reflected in the balance sheet unless the company has paid it off. If the company purchased a lot of overvalued businesses 30 years ago, this will be reflected in the balance sheet today until / unless the company takes a charge and writes down those assets.
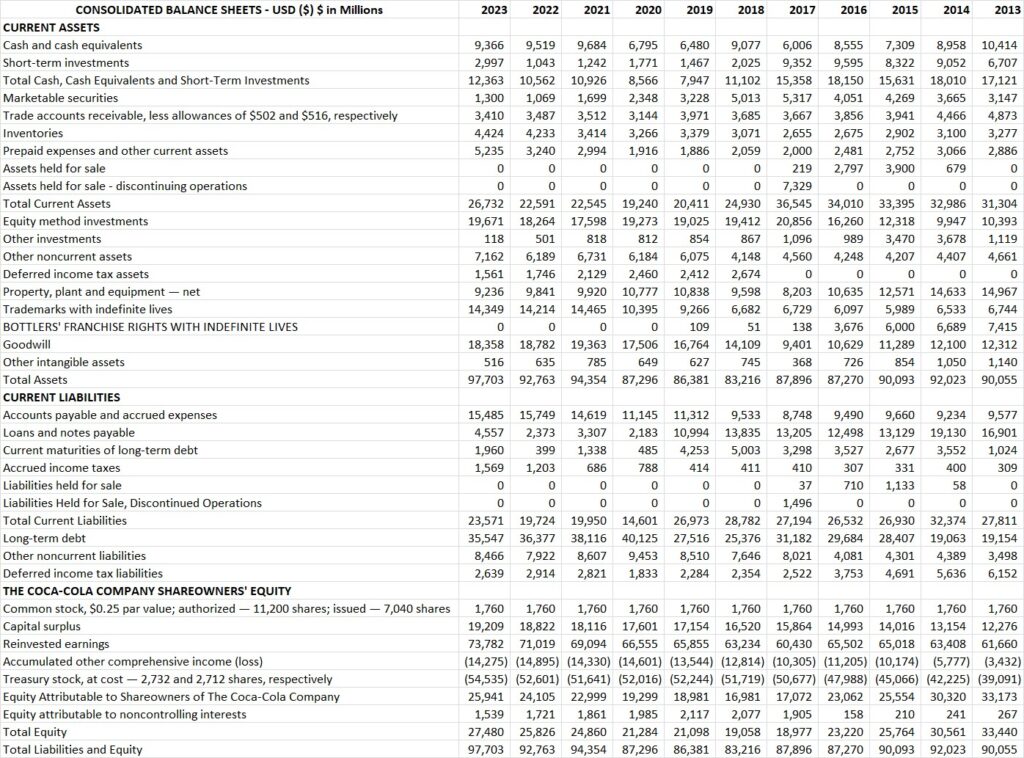
The balance sheet is organized into assets, liabilities and equity. assets are all of the things the business owns. Liabilities are all of the things a business owes to others. Shareholder equity is the value of assets in excess of liabilities. This is the portion of assets and capital that shareholders have put in the businesses, either through direct contribution of capital to the business or through retained earnings (earnings that were not distributed back to shareholders but were instead kept in the business to grow or maintain the business). We are going to use several balance sheet measures in combination with cash flow and income statement measures to assess the financial health of a company as well as the ability of its economic engine to generate cash. Figure 1 shows the balance sheet for the Coca Cola Company continuing our example from last time.
The first priority is to assess the financial health of the company. We have already done this with the interest coverage (how many times we can cover the interest payments on debt with earnings or operating income or operating cash flow). A healthy amount is at least 3-4x operating income and earnings. From the balance sheet, we also want to get an idea of the size of the debt relative to cash flows or operating income. If I tell you a company’s debt is $1 billion, is that large? The answer is, you have no idea. If the company makes $30 billion per year, then that amount of debt is tiny. But if the company only makes $10 million per year, that amount of debt is almost insurmountable. I like to compare the overall debt to operating cash flows to see how big the debt is, relative to the ability of the economic engine of the business to pay that debt. I like to see a company with debt no more than about 10x the median operating cash flow as defined by this measure:
debt / OCF = (long term debt + current portion of debt – cash and equivalents on hand) / operating cash flow
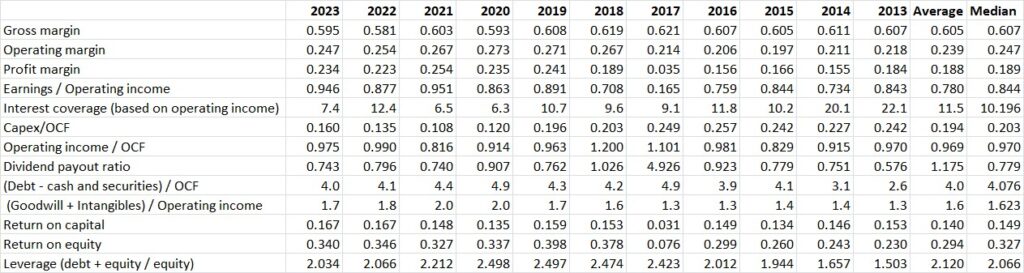
A debt / OCF measure below 10x means that the company can meaningfully change its capital structure should it decide. If the company decides it wants to pay down its debt, it could do so completely in a decade or two. If you have a company that has debt / OCF of 50x, it will likely never pay down that debt. Then again, the interest payments would be burdensome on earnings at that point, and if interest rates go up, the company would have a tough time making payments on debt that it has to renew at higher interest rates. Coke’s debt / OCF is a very healthy 4.0x as shown in the figures of merit calculated in Figure 2.
Next, we want to look at goodwill and intangibles. Goodwill is the amount that our investment paid for past acquisitions over and above the value of assets net of liabilities. For example, Coke has a total amount of assets of $97 billion and liabilities of $70 billion, so assets net of liabilities is $27 billion. Coke’s market value at the time this was written is $295 billion. If some company wanted to acquire Coke, they would likely have to pay shareholders a value substantially in excess of $295 billion. Let’s say hypothetically that an acquiring company would have to pay $400 billion for Coke. The value in excess of Coke’s assets, or $373 billion ($400B – $27B), is the goodwill that the acquirer would record on its balance sheet. This is because shareholders would not simply sell for the value of assets net of liabilities, since the company has a powerful brand name and its economic engine is a cash generating machine. However, some companies acquire a lot of goodwill and other intangible assets (brand names, patents, etc.). If a company overpays for these, the price paid will not be reflected in earnings over time. So, we look at the following measure to ensure that the earnings are justifying these purchases:
acquisition payoff ratio = (goodwill + intangibles) / operating income
I like to see an acquisition payoff ratio better than 10x, but I will sometimes go up to 20x. Cases where I make exceptions are usually when it will take time to realize the benefit of an acquisition, but it has not yet translated into improved earnings and cash flows. Using this measure, you eliminate serial acquirers that don’t use discipline in their purchases, and companies that are trying to look like they are growing earnings by overpaying for things. In a sense, this measure is looking at whether management is managing shareholders’ valuable capital efficiently. Coke’s acquisition payoff ratio is a very healthy 1.6. They have been very prudent with shareholder capital in this respect.
Finally, I have saved the best for last – return on capital and related measures. Return on capital drives everything. If you have an economic engine of a business that can maintain durable and sustainable high returns on capital, you will probably be very happy over long periods of time with that investment, even if you have to overpay a little bit. We try not to overpay, since good valuation during investment does matter. However, that consideration comes in later after we have developed the list and are applying valuation measures to the star list to decide what to purchase.
The simple and quick way to calculate return on invested capital would be earings / (debt + equity – cash). However, if you want to be really accurate, you would dissect the earnings and remove one time effects and only utilize earnings contributed by the economic engine of the business, since you are really interested in the return on capital generated by the economic engine only. For this reason, we use net operating profit after tax (NOPAT) instead of earnings to remove these one time items. Therefore, we calculate return on invested capital as follows:
ROIC = Operating income * (1 – tax rate) / (Total equity + Long term debt + short term debt + any other interest bearing instruments – cash and marketable securities)
Coke’s median ROIC is an outstanding 14.9%. I like to see return on capital above 9-10% for a great business. Beware of high returns on capital. The force of competition is like gravity. It almost always brings returns on capital down to earthly levels over time. For many businesses where there is high return on capital, they cannot sustain it. These companies are often in new businesses, have found a new way to operate, or are otherwise having a temporary competitive advantage. However, if the competition can move in to get a slice of these juicy returns, rest assured it will. There are only a few companies with a durable and sustainable competitive advantage. Usually this is protected from competition somehow. The most common protections are government granted monopolies in the form of patents, trade secrets, copyrights, and trademarks. Another case is a natural monopoly in the form of rights of way or access to certain properties that competition does not have (for example railroads). Still another case is network / first mover advantage. An example of this is everyone using Facebook for Facebook-like social media activities because everyone else is on facebook, so it makes little sense to use the next nearest copycat to Facebook in the same manner. These types of things are rare, but they are the secret sauce you should be looking for when trying to find high return on capital businesses that can maintain the high return on capital over the long haul. Also keep in mind that some protections from competition are relatively more or less assailable than others. For example, high cost of entry into a market is a barrier to many players, but it does not keep a well funded competitor from entering.
Now let’s look at an extension of the concept of ROIC in the form of return on equity (ROE). Companies employ leverage by taking on debt. Therefore, the return on equity is the return to shareholders based on what they have invested. When debt is employed, the return to shareholders is higher, assuming leverage is not so high as to get the company in trouble or pay a suboptimal amount of interest due to poor debt ratings. Return on equity for the economic engine of a business is calculated as
ROE = Operating income * (1- tax rate) / Total equity
For Coke the return on equity is about 33%, which is outstanding. I like to see return on equity above 20% generally, but it is also necessary to have a high return on capital in this case. I do not want the return on equity to be achieved solely by employing excessive leverage in a mediocre business. Such a situation is a recipe for disaster. It might not happen today or tomorrow, but over decades, disaster is inevitable in such a situation. Leverage increases returns when things are going well, but it also makes bad situations much worse when things go poorly. The leverage employed by Coke to achieve it’s return on equity is calculated by
leverage = ROE / ROIC
which for Coke, is 2.1. Here it is interesting to compare businesses. Pepsi often has a similar return on equity to Coke, but if you calculate return on capital, most of the time Coke is better. Therefore, Pepsi must employ greater leverage just to achieve the same ROE as Coke. This means that Coke is a stronger company financially than Pepsi is overall. I generally like to see leverage less than 4-5, usually substantially less. Any more and it is getting quite risky.
So now, we have taken you through some of the screening measures used to identify great companies, utilizing the Coca Cola company as an example. For many of these measures, there is some flexibility depending on the situation and industry, but for others (such as return on invested capital) we have rigid conditions for identifying outstanding businesses. Keep in mind this is not the end-all-be-all set of measures for every business. There are many industry specific measures that are important to determine if a company is good or not. For example, days sales outstanding may be important for a business in an industry that sells on credit and collects money later, or tier 1 capital ratio may be important for a bank. You should learn these measures too, but the ones I have outlined in this series of posts are more general in that they tell you whether a business is good mostly regardless of industry (with perhaps the major difference being in analyzing financial vs. non-financial companies on these general measures). In the next post, we will go over all of these general measures for an average or less desirable company, to see what that looks like compared to Coke.
Leave a Reply