
Analysis of a great company – the cash flow statement
Previously, we looked at the income statement and the kinds of measures we want to see in an outstanding company for addition to our star list for investing. We will continue this exploration with the cash flow statement, and again we will use the Coca Cola Company, as an example case.
First, let’s have a quick discussion about cash flows in general. Cash flows are much harder to fake than earnings where there are many grey areas, such as whether to include something as a charge immediately or whether to capitalize the charge and amortize it over time. Cash flows only happen when there is an actual flow of cash into or out of the company. There are fewer grey areas and it is harder to manipulate cash flows without outright fraud that risks prison time. The disadvantage of cash flows is that they can be much less smooth than earnings.
For example, let’s look at what happens when a company builds a new factory for $1 billion to replace its old and worn out factory, and that the company earns $1 billion per year in profits. We will assume for the sake of simplicity that the company can build that new factory in less than 1 year, and that the company pays for this with cash on hand. The cash flow for building the factory is an immediate -$1billion offset to cash. However, that factory has a useful life of 30 years, so even though we pay for the factory upfront, we get the benefit of the factory for a long time afterwards without having to pay for a new one again for quite a while. So with earnings, we spread out the cost over some time period, usually the useful life of the asset. If we didn’t spread the cost out, the earnings would dip to zero in the year we paid for the factory ($1 billion in earnings – $1 billion factory cost), but since we spread the cost out, we instead see earnings at $967 million per year over the next 30 years. Earnings are smoothed out in this way, but the cash flows move up and down much more, because the cash actually moved in the year the factory was built. Over long times, the cash flows and what the company earns should converge to the same number assuming no manipulations occur. Investors like to look at earnings because this is much smoother and easier to see trends. However, we are perfectly capable of digging into the data, and smoothing out cash flows with averaging ourselves, and this leaves a lot less room for unintentional or deliberate misleading by manipulation. So, the cash flow statement is quite important for our analysis of whether a company is great or not.
Figure 1 shows the last 11 full years of cash flow statements for Coke. The first number we want to focus on is cash flow from operations. This is a very important number that is essentially the cash generated by the economic engine of the business. For a great many businesses, cash flow from operations can jump around quite a bit from year to year. But I have noticed that for the absolute top quality businesses, operating cash flow is much more stable. It is not universal, but it is a good idea to pay attention to this phenomenon. If we compare cash flow from operations to operating income on the income statement, it is also nice to see some consistency or correspondence between these numbers. They don’t have to be the same, but in general if one is bouncing all over the place and the other is more stable or moving in the opposite direction, it is a good idea to dig into the line items on the income statement and the cash flow statement to understand why. Manipulation could be one reason or there could be a legitimate reason. The earnings quality of the best companies tends to be high and these numbers tend to correspond to each other quite well (i.e., move similarly on average). As you can see from Figure 1, Cokes cash flows are very consistent and large.

The next item we want to look at is capital expenditures (capex) under cash flows from investing. This is often called something like “property, plant, and equipment.” There may be other line items under cash flows from investing that make sense to include in capex, like capitalized software costs or acquisition of intangible assets. Add these all together to get the capex number. Now, we compare this capex number to the cash flow from operations above. Why? We want to see businesses that generate absolute gushers of cash (cash flow from operations) while needing to invest relatively little of it back into the business (capex) to keep things running. The best businesses are cash generating machines like Coke. Coke only needed to invest on average 19-20% of its cash flows back into the business as shown in Figure 2 below. The worst businesses have to reinvest virtually all of their cash flow back into the capital heavy business, leaving no cash leftover to compensate investors for the risks they are taking. I generally like to see capex at 30-40% or less of operating cash flows. Keep in mind that if the company has a large capital project, this number can spike higher for a few years, so it is good to get an idea of the average or median capex and compare it to the average or median operating cash flow. There are some businesses where we can go higher than 30-40% capex / operating cash flow, such as railroads, which are natural monopolies. In that case it may be ok to go up to 50%, but again this would only be for a natural monopoly-like business with lots of pricing power. Without pricing power, a company can generate an incredible amount of value for others (like a steel company) but none of that value accrues to the investors of the company. If that’s the case, you shouldn’t be the one investing in that business – let others do that and incur a massive opportunity cost over time by earning poor returns on their investment.
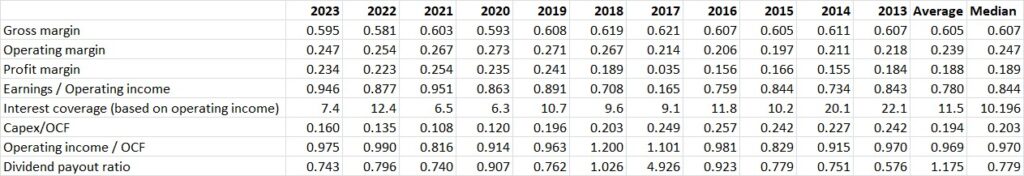
The next important number we want to look at is dividends paid under cash flows from financing. Over long periods of time the earnings / operating income / cash flow should be able to more than cover this dividend. If the dividends are larger than these, the company must borrow money to pay for the dividends. This is not sustainable in the long term and the company will need to cut the dividend or risk getting into financial trouble. You can calculate the payout ratio as dividends paid / earnings. In some short stretches of time, the payout ratio could be >100% due to the fluctuating nature of earnings, but the long term average should be below 100%. I also like to compare dividends paid to operating cash flow and operating income to make sure it is regularly lower than those, or problems will arise eventually. The lower the payout ratio is, the more room a company has to raise the dividend or invest in new opportunities in the future. Coke’s payout ratio has averaged around 78% over the last 10 years, which is acceptable. Given that Coke does not have a high need to use cash for reinvestment into new capital projects (since their capex / operating cash flow is only 19%), it makes sense that they would return capital to shareholders in the form of share buybacks and dividends. For a company like Coke with very stable cash flows and earnings, and low need for reinvestment, a payout ratio of 78% makes sense. For a high growing company with lots of capital investment needs, the payout ratio should be much lower. This same logic applies to purchases of stock under the cash flows from financing – it should be sustainable by earnings, operating income, and operating cash flow, or the company will need to borrow money to continue share buybacks.
The other piece to pay attention to under cash flows from financing is issuance of new debt and payments / retirement of old debt. If a company has lots of debt coming due, but is not able to easily refinance, they need to have lots of cash on hand to be able to handle this, or they might become insolvent relatively quickly. This brings us to the last portion of the cash flow statement, the changes in cash, which is obtained by adding all of the cash flows together, and the total amount of cash on hand. Given the company’s current situation and the typical cash requirements of the business, do they have more than enough cash on hand or are they able to obtain financing relatively easily to keep the business going? If a company has a large debt coming due in 2 years, with no possibility to re-finance at reasonable rates, it might put quite a strain on earnings, or even make the company insolvent. Coke’s situation is rock-solid here, with more than enough cash on hand and ability to refinance old debt coming due at reasonable rates.
Those are the major pieces of the cash flow statement and the important interactions with the income statement. Keep in mind that for the full analysis of a company, you will want to delve into each of the numbers on these statements and understand why they are what they are and how they interact. There are also industry specific measures for how you analyze a company which we don’t cover here. You don’t analyze a software company quite the same way that you do a grocery store chain. This series is more focused on providing a high level analysis for initial screening to identify potentially great companies for a further, more in depth analysis. In that sense, I am trying to provide some high level heuristics of what to look for in a great company. Every company is unique, so once some candidates are identified, it is important to dive in and understand the nuances of the story before finally adding a company to your list. In the next post, we will introduce the final component to the equation – the balance sheet. We will also finally show how all of the financial statements can be used together to identify great companies.
Leave a Reply