
Previously, we looked at analyzing the income statement, the cash flow statement, and the balance sheet for a great company – the Coca Cola Company. Using these tools, we looked at the kinds of measures we want to see in an outstanding company for addition to our star list for investing. Now, we will look at a weaker company in a tougher business to compare, so that we can see what differences jump out at us. We are going to look at a company called Alcoa. Alcoa is a major producer of aluminum metal. Aluminum metal production confers enormous benefits to society, but little to none of that benefit accrues to the investors in the Alcoa company.
Figures 1, 2, and 3 show the income statement, the cash flow statement, and the balance sheet, respectively, for Alcoa for the past 10 full years (2014 – 2023). Prior to 2016 portions of Alcoa that make finished aluminum parts were spun off, so we will just be looking at the mining and refining business. Results for 2015 were provided in the annual report for Alcoa based on the mining and refining business only and excluding the spun off entity. There was no balance sheet data provided for 2014, so we will use the 2015 balance sheet numbers as an approximation to provide some data for 2014. The cash flow statement and income statement data were provided for the 2014 fiscal year, so we don’t need to make any approximations with those numbers.

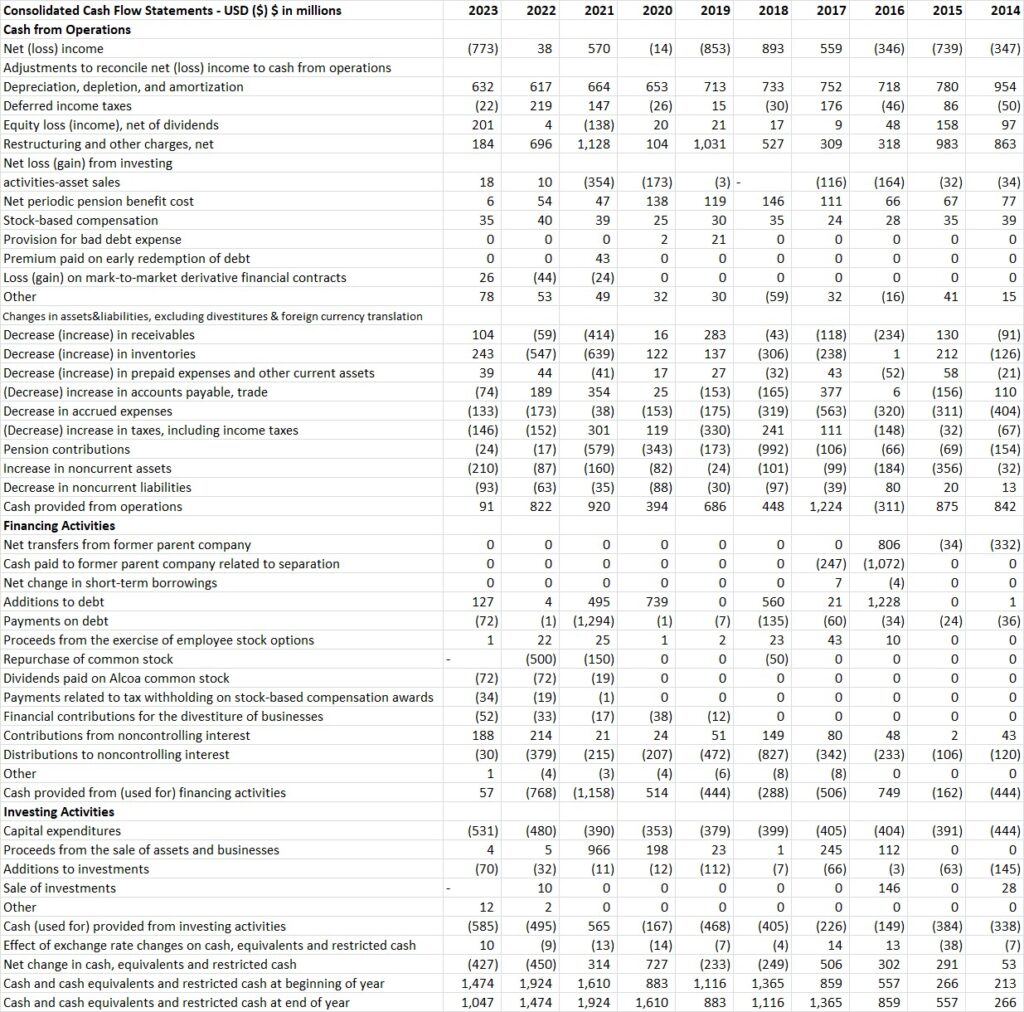

Figure 4 shows the figures of merit that we will calculate from these financial statements. Median gross margin is around 18-19% which is quite low. Recall that Coke’s median gross margin was an amazing 60-61%. Alcoa is definitely not shaping up to be the kind of business that has a competitive advantage or a monopoly like hold on its market already. It is well below what I like to see (minimum 30-40% gross margin). I can sometimes make exceptions for this depending on other factors, but let’s dig further. Operating margin is substantially lower than gross margin at around 9%. A greater than 50% reduction from gross margin. This is not looking very promising for making an exception to the minimum gross margin guidelines. If I were to make an exception, I would like to see a lot of that already small gross margin translating directly to the bottom line (i.e., the earnings of the company) with few additional reductions. Now, let’s look at median profit margin over the 10 year period, which is a dismal -1.4%. Over a 10 year period, the company on average lost money. I want to see a profit margin of at least 10% on long time scales to give plenty of margin for things to go wrong, and really, a profit margin substantially higher than 10% is preferable. With Alcoa, it already looks like plenty is going wrong. The earnings / operating income number in Figure 4, really doesn’t make sense to talk about for a business where there are lots of negative earnings and negative operating incomes. It will give non-sensical results, so we will not discuss it further. In any case, we already have a picture that Alcoa’s earnings quality is not great.
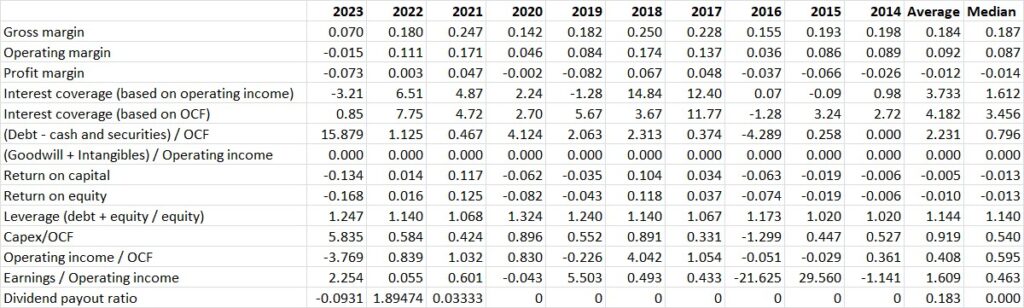
Next, let’s look at interest coverage to get an idea of whether or not Alcoa is able to pay its debts. Alcoa’s median interest coverage based on operating income is 1.6. This isn’t great. I like to see a median above 3x at a bare minimum. Note that the average interest coverage is around 3.7x but this is due to an outlier number in 2018. I like to use the median value whenever I can, since the median tends to throw out large outlier years that skew the data, while the average includes these outliers. With a 1.6x interest coverage ratio, Alcoa is able to pay the interest on its debt payment obligations, but it has only a small cushion for things to go wrong. Here we will more strongly emphasize the interest coverage based on operating income rather than operating cash flow. Alcoa is a business that requires a lot of capital investment just to stay in business. Therefore the company needs to be able to also pay for capex to stay in business in addition to the interest on the debt. Operating income does include a non-cash charge called depreciation that is coming from the cost of maintaining a company’s capital, so we prefer here to use the interest coverage based on operating income.
Now, let’s look at debt a bit further. What is the total debt net of cash divided by operating cash flow? For Alcoa, the median debt / OCF is about 0.8. This means if Alcoa devoted all of its cash flow from business to paying down its debt, it would take a little under a year to do so. The absolute size of Alcoa’s debt is therefore not very large. If Alcoa needed to pay down debt because it had difficulty rolling the debt into newly issued bonds at attractive rates, it could probably do so over the course of just a few years.
If we compare Alcoa’s capital expenditures and operating cash flows, we see that Capex / OCF has a median value of 54%. This means Alcoa must devote more than 50% of the cash generated by its business to capital spending just to keep running. We like to see this below 30-40% usually, with some exceptions granted for businesses that have a lot of other things going for them. Alcoa is not one of those exceptions so far.
Next, let’s look at Alcoa’s acquisitions and whether they are paying off. If we look at goodwill plus intangibles, we see that it is zero in every year. This entity that has been created in 2016 does not appear to have made any acquisitions necessitating goodwill on the balance sheet. Goodwill and intangibles / operating income is therefore zero over the entire period. Alcoa is not making bad acquisitions or acquisitions for which it overpays.
As far as dividends, Alcoa has only paid them in the last 3 fiscal years. The payout ratio is so far ok at around an average of 18%. Time will tell if this becomes an unsustainable burden for Alcoa. We will need more dividend history for Alcoa to assess this in the future, assuming that they continue to pay a dividend.
Finally, let’s examine return on capital and return on equity. Alcoa’s median return on capital is around -1.3%. We had to modify our normal formula for return on capital because of the fact that Alcoa has some years where operating income is negative, so calculating a tax rate is trickier. Normally we would use this formula:
ROC = operating income (1-tax rate) / (debt + equity – cash and equivalents)
We would normally estimate the tax rate using the following formula from these income statement items
tax rate = provision for income taxes / operating income
This formula doesn’t make sense to use when operating income is negative, since it will make the tax rate negative. In this case, we modified the formula to be:
ROC = (operating income – provision for income taxes) / (debt + equity + cash and equivalents)
This is a good approximation since the taxes paid tend not to be very large in these years for Alcoa. You can also delve into the tax rates in the notes of the financial statement in the annual report if you wish to further refine the estimate of taxes paid on the operating income only. The effort is worthwhile if you have a business you are seriously interested in analyzing further, which is probably not the case with Alcoa. Whichever method you use, the return on capital that you estimate will be near zero and probably slightly negative for Alcoa. This is a terrible business for an investor to be in, because it is destroying value (from the perspective of the investor, at least). In order for a company to generate value, it must earn a return on capital above its weighted average cost of capital. Cost of capital will never be below zero in any scenario that I can imagine, so Alcoa destroys value. If Alcoa tries to grow, and does not also improve its return on capital, it will destroy value faster, as we discussed in a previous post. You can place your money in a nearly risk free instrument like 30 year government bonds and do much better than the risky Alcoa.
If we calculate return on equity in the same way, we find that Alcoa has a median return on equity of around -1.3%. Calculating Alcoa’s leverage, it is around 1.1x. At least Alcoa does not employ much leverage at all. If they did, return on equity would be even more negative than return on capital by a lot. Remember that leverage works both ways, it makes the good return better, but it also makes the bad loss much worse.
Overall, you can see that Alcoa is a much worse business than Coke on these preliminary measures of analysis. Based on our typical minimums that we like to see for these figures of merit, Alcoa is not just a worse business than Coke, which is understandable since Coke is an amazing business, but it is objectively not a business we even want to consider for our list at all regardless of how it compares with any other business.
What is the underlying cause of Alcoa being a not-so-great business? It all boils down to aluminum being an undifferentiated market with no ability for Alcoa to gain much of a competitive advantage. No amount of great management can change this either. If you buy 6061 aluminum alloy, it is standard across the industry. You really don’t care where you get it from as long as it meets the specification for that material. There is no name brand protection. There is no patent protection. Nothing. So, competitors can only compete on price, volume, economies of scale, geography, etc. These are not very strong competitive protections, so it becomes a race to the bottom in price. Aluminum producers tend to operate on razor thin margins, and if anything goes wrong they can quickly find themselves in financial difficulty. In short, let other investors chase after such bad plays that will, in aggregate, lose over the long-term. You should focus your energy on identifying and acquiring great businesses at reasonable prices that you will be very glad you bought decades from now. You should be glad when a business like Coke goes on sale, and buy it with the intent to keep it forever, when it does.
Leave a Reply