
In the previous set of posts on equity allocation of investors, we looked at predicting long term market returns on a nominal basis. What we actually want to be able to do is predict real returns after inflation. This will be an important capability to determine the maximum safe withdrawal rate in retirement. The Trinity study famously showed that a 4% withdrawal rate was safe under almost all periods studied from 1926 – 1995 for a portfolio allocated to 75% stocks and 25% bonds. In fact, the 4% safe withdrawal was successful 98% of the time for a 30 year retirement. However, several commentators have noted that a 4% safe withdrawal rate usually leaves the retiree with far more at death, and that in these situations a far higher withdrawal rate was an option, if only this situation could have been predicted. The maximum safe withdrawal rate is correlated to the real return (return adjusted for inflation). The reason for this is that the retiree will adjust the 4% withdrawal every year up or down by inflation to maintain the same buying power or standard of living.
Before we go about examining safe withdrawal rates in retirement, we need to look at models for predicting inflation over long periods of time (10 years or more). This is long enough to smooth out the volatility of short-term events, but still capture the trend. Plus, it is usually what happens with the market and the economy in the first 10 years of retirement that has an outsized effect in determining what the maximum safe withdrawal rate is. There is a sequence of returns risk associated with the withdrawals that you make from savings in retirement, and if you earn poor returns or have inflation erode your savings early in retirement, that has a bigger effect than if it happens near the end of retirement. Therefore, we will focus on inflation predictions over a 10 year time horizon, since we most need to predict what will happen in the first 10 years.
Inflation is quite tricky, because many of the things that cause it to go higher or lower cannot be foreseen, such as oil shocks, or the Covid outbreak and the government response to that situation, or the 2008 housing crisis. Some of these things can be foreseen a little ahead of time, but not 10 years ahead. So, any predictor of inflation will necessarily have some aspects that are wrong at turning points – in other words, the 10 year inflation predictor that you choose will probably lag the actual 10 year inflation. However, the measure may not need to be perfect, but just good enough to get us close to real returns in the market.
The best predictor of future 10 year inflation that I have found is the 10 year expected inflation rate data published by the Federal Reserve Bank of St. Louis here. The annualized 10 year expected inflation is shown alongside the actual annualized 10 year inflation rate in Figure 1.
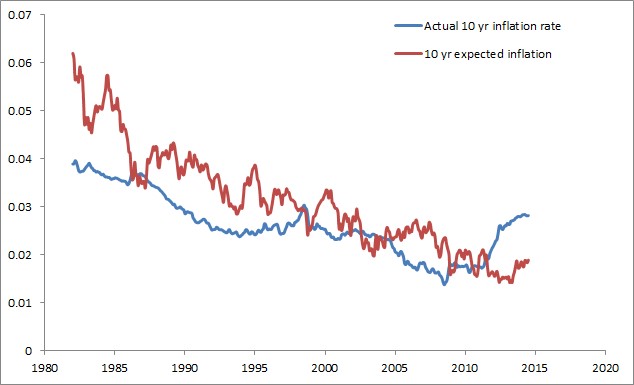
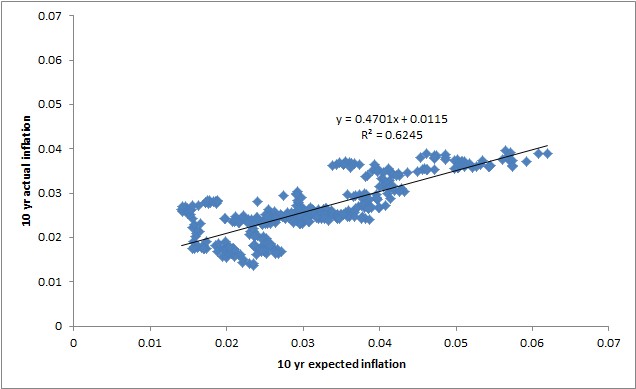
Figure 2 plots the actual 10 year inflation vs. the 10 year expected inflation with a linear model fit to the data. The correlation between the prediction and the actual value is decent with an R2 of 0.62. Most importantly, the larger trend of prediciton is fairly accurate, even if some of the smaller bumps and dips are not perfect.
One thing that is immediately apparent from Figure 1 is the lagging behavior of this data. The estimate overpredicted inflation during the long-term downtrend, and underpredicted inflation from the spike up due to Covid and the government response to the epidemic. Using the linearized model fit of the expected 10 year inflation vs. the actual data, we see that the model does predict inflation well as shown in Figure 3. Both the over- and under-prediction are reduced in this model.

Unfortunately, this data only goes back to 1982, and since that time we have been in a secular downtrend in inflation, which has only bottomed recently. We have not seen the lag during a long term secular uptrend. We do see from the Covid spike that it also lags on the way up. Plotting the residuals of the data (shown in Figure 4), we do not see the typically expected noise pattern we would expect of random noise, but instead, we see a sinusoidal pattern indicative of lag. The greatest error was at turning points where major new events are within the 10 year window (such as Covid or the housing crash). Therefore, despite the model fit being pretty good (it predicts past inflation within +/-1%) I would expect that forward predictions could be off by even 2-3x that amount. Still a prediction for inflation that falls within +/-3% may be good enough for estimating real returns.

The good news is that high inflation can often be observed as it happens, and the retiree can make adjustments within reason to accommodate the few situations that caused the 4% safe withdrawal rule to fail. The main situation in which the 4% rule failed was stagflation (high inflation with poor economic growth).
A few people also worry about hyperinflation, but this is relatively uncommon in developed nations now. It would also take extreme measures to manifest and these can usually be seen as they are unfolding so that action can be taken to protect your assets, such as shifting them to different countries or asset classes that can withstand inflation. Hyperinflation doesn’t often come out of the blue, but instead usually involves political situations that develop over time. A lot of these scenarios boil down to either destruction of means of production (devastating wars and the like) or confiscation of means of production from productive individuals or groups resulting in drastic drops in production, while demand for this production remains. While printing of currency taken to extreme can cause high inflation also, there are many cases where it is a symptom or aggravating factor of hyperinflation after destruction or impairment of production has already occurred and caused excessive inflation.
Normal inflation is usually mean reverting or at least stable, while hyperinflation is not stable and tends to run away if the situation is not somehow aggressively arrested by restoring production or reducing demand. In short, under most situations, if the retiree is willing to dynamically adjust their withdrawal rate based on current situations, they can probably navigate many different kinds of obstacles.
Now that we have some means of predicting future trends in 10 year inflation, we can use this along with our models for predicting future 10 year nominal market returns to understand real 10 year returns in the market. We can further use this data to see if we can make better predictions about safe withdrawal rates. In the next few posts, we will turn our attention to real returns and safe withdrawal rates. We will look at market data to make updates to the Trinity study to see if we can understand how to predict what safe withdrawal rate we can use given the current market and predicted inflation.
Leave a Reply