
We have made attempts to predict long term nominal (before inflation) returns in the market with great success using the equity allocation of investors. However, in order to predict what safe withdrawal rate we can maintain in retirement, we need to be able to predict real returns (that is, returns after inflation). The reason for this is that inflation will erode purchasing power in retirement. The methodology of the famous Trinity study says that a 4% safe withdrawal rate is 98% successful over the period 1926-1995. In that study, after the 1st year of retirement where the retiree draws 4% of the balance to live, the 4% withdrawal rate is adjusted upwards or downwards each year after by the rate of inflation to maintain a constant purchasing power. Of course, you can change the withdrawal rate based on current market conditions, but many people prefer to know long beforehand how much they can draw each year in retirement while maintaining constant purchasing power and their standard of living. This allows them to plan how much they need to save. But because inflation comes into play with this calculation, you need to be able to predict real returns in the market to know what the maximum safe withdrawal rate is.
In the post last week, I talked about one possible predictor of inflation – the 10 year expected inflation gauge published by the Federal Reserve Bank of St. Louis. This gauge has the highest correlation to 10 year actual inflation that I could find. We are most interested in predicting inflation over 10 year and similar time periods. The reason for this is that what happens in the first 10 years of retirement tends to have the biggest effect on whether the portfolio succeeds or fails at a given initial safe withdrawal rate. This is a sequence of returns risk – poor performance or good performance, particularly a string of these in early years, will determine if the portfolio fails or has more than enough to support the person in retirement.
The 10 year expected inflation predicted the future 10 year inflation moderately okay with an R2 value of 0.62. The 10 year expected inflation did have some issues though. First, data are only available back to 1982 for this measure. Unfortunately, this is only observing the measure over 1 secular downtrend in inflation, while having no observations over a major secular uptrend. The second shortcoming is that it tends to lag actual inflation, due to the impossibility of predicting major events like Covid and the housing crash a decade beforehand.
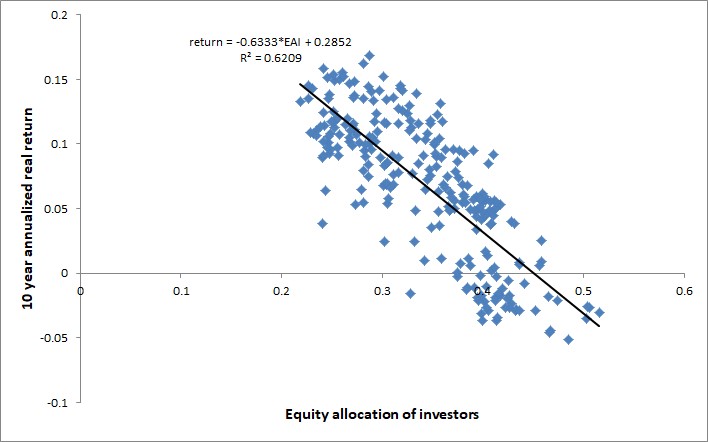
We are now going to see how well we can do to come up with a measure for long term real (inflation adjusted) 10 year annualized returns in the market. First, let’s look at how well equity allocation of investors by itself predicts real returns. If you recall from this post, the equity allocation of investors predicts nominal 10 year annualized returns quite accurately with an R2 value of -0.90. If we now fit the equity allocation of investors to real returns instead of nominal returns, we see that the R2 value falls to -0.62. This is ok but not great – we want to see if we can improve on this. Figure 1 shows the model fit of equity allocation of investors to real returns, and Figure 2 shows past, and future predicted returns compared against the real 10 year return as measured from the rate of inflation plus the market return.
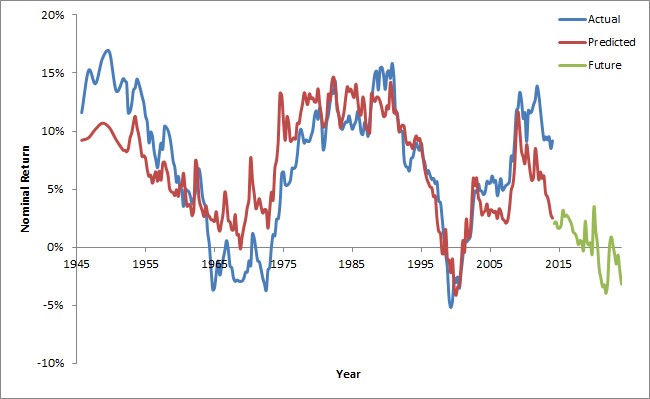
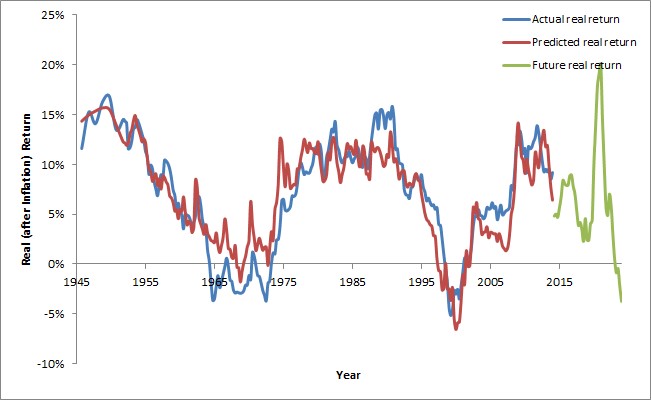
As you can see from Figure 2, the general trend is well predicted, but there is substantial error at times in the prediction. Next, let’s fit the better model which utilizes equity allocation of investors plus the 10 year treasury bond “P/E” (1 divided by the bond yield, aka 1 / GS10), which serves as an anchor for investor expectations about the market. If you recall, this model predicted nominal returns with even better results than equity allocation of investors alone, having an R2 of 0.935. Now what happens if we fit this model to real 10 year annualized returns in the market? Figure 3 shows the past and future predicted returns again compared against the real 10 year annualized return as measured from inflation together with the market return. The R2 for this model fit is 0.88! This is excellent accuracy for predicting real returns. It is not surprising that the model fits better than equity allocation of investors alone, because the 10 year bond is correlated with 10 year inflation, so it contains some market information about inflation in the future.
This prediction held up well over the entire time period of available data from 1945 – present. What happens now if we try to incorporate the 10 year expected inflation measure published by the Federal Reserve Bank of St. Louis? Adjusting our data time period from 1982 – present due to no data for expected inflation before that timeframe, we see that the equity allocation of investors + 10 year treasury P/E model gives a fit to the data with an R2 of 0.925. If we add expected 10 year inflation into this model, the R2 only increases ever so slightly to 0.926. It appears that most or all of the available information about future inflation is already incorporated into the 10 year treasury bond P/E, which we call 1 / GS10, without the need for this additional measure of 10 year expected inflation. This is excellent news because we have 10 year bond yields (GS10) going back to 1871 while we only have limited data back to 1982 about the 10 year expected inflation measure. This is a much longer history from which we can draw inferences and comparisons.
I did not expect to have such a good predictor of real market returns as given by the model incorporating equity allocation of investors and the 10 year treasury P/E. We will use this model in a future post to see if we can predict maximum safe withdrawal rates in the market. In the next post, however, I first plan to go over an updated simulation of safe withdrawal rates in the market using the available data for stocks and 10 year treasuries dating back to 1871. I think it is better to update the Trinitiy study first with this data, to draw on more time periods, in order to see how the 4% rule for safe withdrawal rates holds up. Stay tuned for more…
In the meantime, it is interesting that this model is predicting quite negative real returns at this time for the next 10 years in the market (-3.8% annualized). With the recent increase in the S&P500 since the beginning of this year (Q1 of 2024 is the latest publication of equity allocation of investors), the predicted real return is even more negative (-5.3% annualized). Negative real returns do not happen terribly often, and if you are planning to retire in the near future, you may want to make sure you have an extra cushion of savings against negative real returns over the next 10 years. I will periodically publish the expected real and nominal 10 year annualized returns in the market as new data for equity allocation of investors and 10 year bond yields are published.
Leave a Reply