
We have been talking a lot about how durable and sustainable returns on capital lead to superior returns over long time horizons. I thought it might be instructive to look industry by industry and market sector by market sector to learn if there are any patterns to return on capital. If we know what to look for, perhaps we can make intelligent decisions about the types of investments we add to our Star List of companies, knowing that those companies have a good chance of maintaining high returns on capital.
One issue of course, is that returns vary from year to year, so we are going to take a long term look at some of the trends in return on capital. The first thing to note, is that returns on capital for the overall US stock market have been relatively stable over the timeframe we have reasonable data. This study by Jiang and Koller at McKinsey & Company is quite instructive. While there is normal variation over the business cycle, the return on capital for the market has ranged from around 7.7 – 14% with an average of around 9.9% (median 11.1%) for the period from 1963-2004. There is a notable increase in ROIC from the 1990’s onward, although there is still some debate about whether this increase is real or just a temporary phenomenon or possibly random variations. It is thought by many, however, to be a real effect caused by increasing profit margins over time, due to more efficient processes, and lower costs (better inventory management, just in time supply chains, lower interest rates, etc.). The median ROIC over the 1963-2004 period was 11.1%, as compared to 12.2% over the 1995-2004, and the trend appears to be continuing.
There may be a small reversal in this trend due to Covid demonstrating the lack of robustness in supply chains, since companies were left without inventory when they needed it, when supplies dried up, so there is some readjustment going on – companies holding higher inventory, re-shoring some production despite higher costs to guarantee supplies, etc. However, I think that the in the long term, there will continue to be a very slight uptick in return on capital due to better technologies, software, supply chain management, geographic arbitrage, and so on, leading to better efficiencies and profit margins.
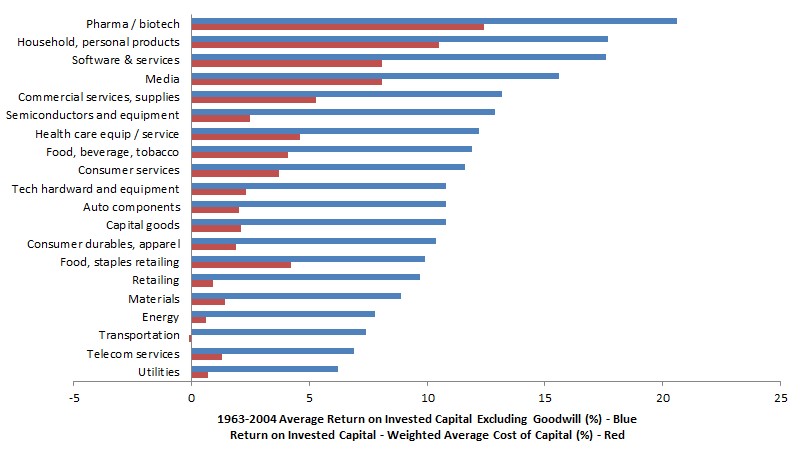
This McKinsey study also breaks down long term ROIC by industry. Using data from this study, I have created a chart of return on capital by industry, as shown in Figure 1 (blue bars). The industries are arranged by ROIC from highest to lowest. We see that industries like Pharmaceuticals & Biotechnology and Software & Services have very high returns on capital while industries like Telecom and Utilities have very low returns on capital. Using data from this source, I estimated cost of capital for each of these industries. The red bars in Figure 1 are ROIC minus cost of capital to show which industries earn the highest returns above cost of capital. Again, industries like Pharmaceuticals & Biotech and Software & Services score high, while things like Telecom, Transports, and Utilities score very low.
Are there any patters we can discern from this data? To help, let’s look at another source of data and compare. In Jeremy Seigel’s The Future For Investors: Why The Tried And The True Triumph Over The Bold And The New, he looked at all stocks in S&P 500 in 1957 and laboriously traced all returns for each up until 2003. He found that consumer staples like Phillip Morris (now called Altria) and Coca Cola were top performers along with Pharmaceutical companies. We can start to see a common thread now amongst high return on capital companies. They generally have something that can be protected from erosion by competition, which gives them pricing power and ability to maintain high returns on capital over time. Pharmaceuticals and Biotech have patents – a government granted monopoly for 20 years on the invention. Coca Cola and Phillip Morris have powerful name brands with loyal followers. No one can copy the Coca Cola name, and in addition, the formula for Coke is protected as a trade secret. Patents, copyrights, trademarks, and trade secrets are a set of government granted monopolies that protect these companies from competition to an extent. We as a society have decided that granting these temporary or long term monopolies has greater benefit to us as a society by fostering risk taking and innovation, than the downsides that monopolies can bring.
Let’s look at the flipside now. Utilities, telephone companies, and transports (railroads, airlines, etc.) all have low returns on capital. These companies also have natural monopolies. For an electric utility, once the rights of way are secured and the power lines are built out it can make little sense for another power company to come in and try to compete, because duplicating the infrastructure is difficult and expensive, and the first mover has too great of an advantage. The situation is similar for a telephone company or a railroad. However, there is one key difference here, in these cases, the government regulates the monopoly to limit the company taking advantage of this situation. We as a society have decided that the costs of allowing these monopolies free reign outweigh the benefits.
For example, in the case of a public utility, such as an electric company, the value this company provides to society is immense, but that value does not accrue to the investors in the electric company. This is because, the government often uses “rate of return regulation” to limit the rate of return a utility can earn. This rate of return is limited so that the public can benefit from broad access to the value of the provided service while avoiding price gouging by the company due to its natural monopoly.
Other industries have faced similar situations, but there are also recent changes to some of these sectors. Regulation of telephone companies has decreased over the years, but new wireless technology has come into play. While wireless spectrum is still limited, there is generally enough available to allow several players in each market, and more spectrum is being made available over time. Railroads were heavily regulated starting in 1887 and were eventually deregulated in 1980 after it was determined that regulation was stifling the industry. However, this had an enormous impact on long term returns for investors. Railroads have gradually bounced back, and there have started to be improvements, but it will still take some time.
We can also look at a different set of data based on changes in industry market shares to see if we come to the same conclusion. Figure 2 shows market share for major stock market sectors in 1908 (blue bars) and 2018 (red bars) while Figure 3 shows the relative change in market share over this 110 year period.

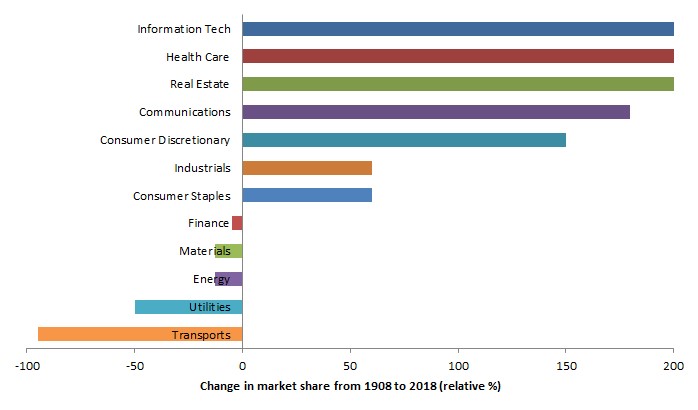
Some industries like information technology and health care essentially did not exist in 1908, so the growth in market share for those sectors is skewed to enormously large numbers. For the rest, the relative change in market share demonstrates which industries grew faster than others. We see similar conclusions, transports and utilities were terrible investments. This is skewed somewhat by the fact that railroads were just starting to come down from the 19th century peak bubble that was absolutely enormous, and they continued to suffer large declines in market share throughout the first half of the 20th century. The communications sector unfortunately includes both telephone / telecom as well as media and advertising, but looking at a basket of telephone companies by themselves produced horrible long term returns, while media such as print and TV saw enormous growth over this time period. More recently, traditional forms of media are in decline while newer forms, such as Youtube, are growing.
Health care, consumer discretionary, and information technology had enormous growth. Specialized know-how, patents, trademarks, and trade secrets are tools commonly employed in these spaces to maintain a moat around the business, protecting returns on capital. Interestingly, real estate also did quite well. A lot of this growth happened in the last 2-3 decades when interest rates were lower. This led to more available money to purchase real estate. More dollars chasing a limited supply of real estate can then lead to price appreciation in that asset class. Further elaborating on real estate, it can be either an interchangeable commodity-like asset or a monopoly-like asset depending on location, desirability, uses for the land, mineral deposits, etc.
Maintaining high returns on capital for long periods of time is generally difficult, since competitors will usually enter a profitable market and erode returns on capital over time. Where return on capital is maintained for exceptionally long periods of time, there is usually some type of effective monopoly (or at least a duopoly / oligopoly) of something, be it a name brand, a right to sell an invention, or specialized know-how that no one else has. These tend to be inherent in certain market sectors and not in others. For example, steel companies don’t really have a name brand. One 316 alloy stainless steel plate from one manufacturer is pretty much the same as another, so differentiation only exists on price. In that situation, it’s a race to the bottom with the lowest price seller winning the sale. Steel companies provide enormous value to society, but none of that value accrues to the investors in the steel company. Every few years, several of these steel companies go broke and need to re-capitalize, wiping out shareholders.
The sectors and companies that tend to have better than average returns on capital long term seem to be in these spaces: health care, pharmaceuticals and biotechnology, consumer discretionary, software, tobacco, alcoholic beverages, non-alcoholic beverages, household and personal products, and so on.
The sectors and companies that tend to do worse seem to be in these spaces: utilities, telecom, energy, materials and transports. I would say, however, that railroads are likely to do much better in the future due to government de-regulation, since they are natural monopolies and provide a lot of value. It is much more difficult to secure rights-of-way and purchases of contiguous pieces of land to build a railway, than it is for a new airline to fly any which route they want in the sky, to use another transport example. So in the transports space, I expect railroads to reverse and do fairly well over the next century.
Another bit of interesting information in the energy sector deserves pointing out. While that sector had low performance over the long term, Jeremy Siegel in The Future for Investors: Why The Tried And The True Triumph Over The Bold And The New, his book based on this study, noted that several large oil companies had exceptionally high returns from 1957-2003 relative to the S&P500. It would seem that some of the oil majors have quite good returns on capital while the rest of the energy sector does quite poorly, so don’t discard the oil majors as you look for high ROIC businesses to add to your Star List of companies.
As you look for companies, it can help to concentrate on those sectors that are favorable, and be careful about picking stocks in sectors that traditionally have poor returns on capital. Not that you can’t go against this advice if you have a very good reason to think that a company will have superior return on capital, but you better make sure you understand well what allows that company to earn durable and sustainable high returns on capital before you go against the grain. This also goes to show that simply investing in every sector just for the sake of diversification is probably not a great idea on long time scales. Diworsification as it’s called, is real and you are better off diversifying strategically, and with forethought than simply buying every possible permutation available in the market. If you simply construct an index that is the S&P500 minus utilities, telecom, steel and aluminum, airlines, and other terrible return on capital industries, you could easily create an index that outperforms the S&P500 as a whole. This is essentially what we are doing when we create our Star List of companies. We are creating an index. But we don’t have to buy all of the companies on this index list at once. We can instead afford to wait until each of them goes on sale before buying by only purchasing the best deals on the list. This can be according to low valuation, lowest price paid for high growth, or other measures that you choose to implement. In effect, this is creating a value weighted index of stocks to own, and this is the method we practice for our own investing.
Leave a Reply