
In the previous post, we discussed the Kelly criterion as a useful tool to determine allocations of stocks. To briefly recap, the Kelly criterion is as follows:
f = p – (1-p)/b
Where, f is the fraction of the bankroll or portfolio value to wager, p is the probability of a win (1-p is the probability of a loss), and b is the proportion of the bet gained with a win divided by the proportion lost with a loss (i.e., the odds expressed as a decimal fraction). We also discussed that using the ½ Kelly bet (f/2) is most advised for imprecisely known situations, such as stock investing.
In this post, I want to use the Kelly criterion to determine maximum portfolio allocations to each stock in your portfolio, to see what this might say about allocations. You commonly hear people saying all manner of things about allocations, such as when you have conviction, go hard on a stock (sometimes allocating 40-50% to a single stock). Others say never allocate more than 5%/10%/20% to any one stock. Alternatively, people say to have at least 5/10/20 stocks in your portfolio, and they imply roughly equal allocations to each. This is the same as specifying an allocation, since if you desire to have at least 5 stocks equally allocated in your portfolio, this is the same as saying your stock allocation should be 20% to any each stock. However you state it, there are many seemingly conflicting statements about allocation in the investing world. So what allocation should we choose? I believe the Kelly criterion can provide a useful perspective on this for us.
The issue for individual stocks is that each one is different and subject to its own idiosyncratic risks (risks specific to that one stock). For example, an insurance company might be at more risk of a bad hurricane season and large losses. A steel manufacturer may be more subject to risks from economic downturns which cause bankruptcy due to heavy debt loads and large fixed costs. So how can we handle this? One way is to look at indices of stocks. An index is a large average of stocks, and by averaging, we average out most or all of the idiosyncratic risks, such that only risks inherent to all stocks as a whole or to the market of which they are a part remain. We can then get an idea of what the maximum allocation should ever be to a perfectly risk minimized stock, and reduce this allocation accordingly based on our conviction to the stock or based on the individual risks that the stock brings to the table.
So, we know we want to use the Kelly criterion on an index to get some idea of this, but now we are faced with another problem, which we referred to in the previous post, the problem of timeframe. The Kelly bet is a singular event, and is not dependent on holding time. It is a formula for which a single bet is placed, and the outcome is determined. With stocks, we need to understand what the bet is. Is it a bet on a stock for 1 year, or 20 years? To overcome this issue we are going to look at 2 timeframes, a short one (1 year), and a long one (26 years) to see if we can understand this. First, let’s look at the index on the 1 year timeframe to see what kind of stock allocation we get.
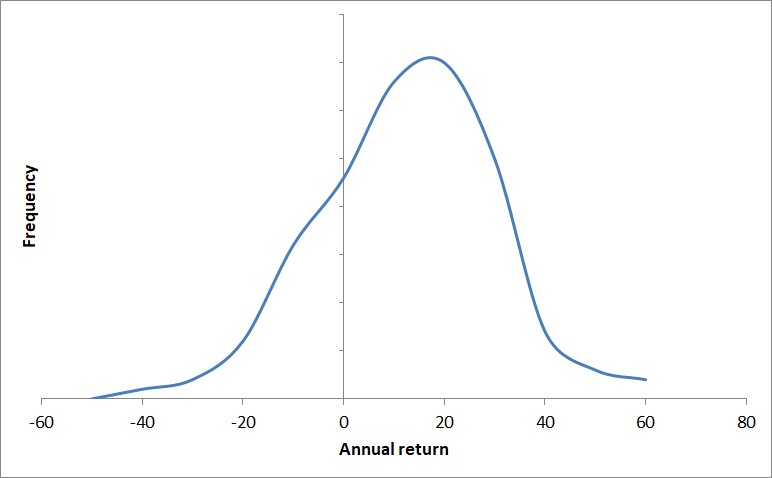
Figure 1 shows the distribution of annual total returns on the S&P500 over the time period from 1871-2023, calculated using the data from Robert Shiller here. Over this 153 year period, there were 48 losing years and 105 winning years, giving a win rate of 68.63% (p = 0.6863). The average win is a growth of 16.7%, while the average loss is a shrinkage of 12.4%, giving b = 16.7%/12.4% = 1.34. Therefore, the Kelly bet is f = 0.686 – (1-0.686)/1.34 = 0.452. On a 1 year holding timeframe, the Kelly bet says we should never bet more than 45.2% on a stock which has no idiosyncratic risk (only systemic risks are present, i.e., risks common to the whole system). As we said in the previous post, you should only ever use the ½ Kelly bet, due to uncertainties in estimation and due to assumptions made, so we reduce this figure to 22.6% maximum allocation to any one stock.
For longer timeframes of analysis we have a couple of issues. For holding periods on timeframes of at least than 20 years, there has never been a losing 2 decade period for the S&P500. The Kelly criterion then predicts that your allocation to the S&P500 should be 100%, which is indeed an acceptable practice for those able to hold for long time periods without needing the money. However, there is a more subtle, but very big issue. The S&P500 of today is not the S&P500 of 20 years ago. It is not composed of the same stocks due to turnover. In fact, more than half of its stocks are different, so it is not even close to the same thing. You tend to think of the S&P500 as one stock, but it isn’t. It is instead a grouping of stocks with rules about what gets included and kicked out. The average company’s lifetime on the S&P500 is around 15-20 years currently. Given that we don’t have the same thing, we can’t very well say that it is an average of the set of stocks we are looking at. We introduce all sorts of biases in the longer term S&P500 look. Survivorship bias being big among those (the companies that did well get included, while companies that do poorly get excluded over the time period). We need to account for all of this if we want to understand allocations to individual stocks within our portfolio on long time frames.
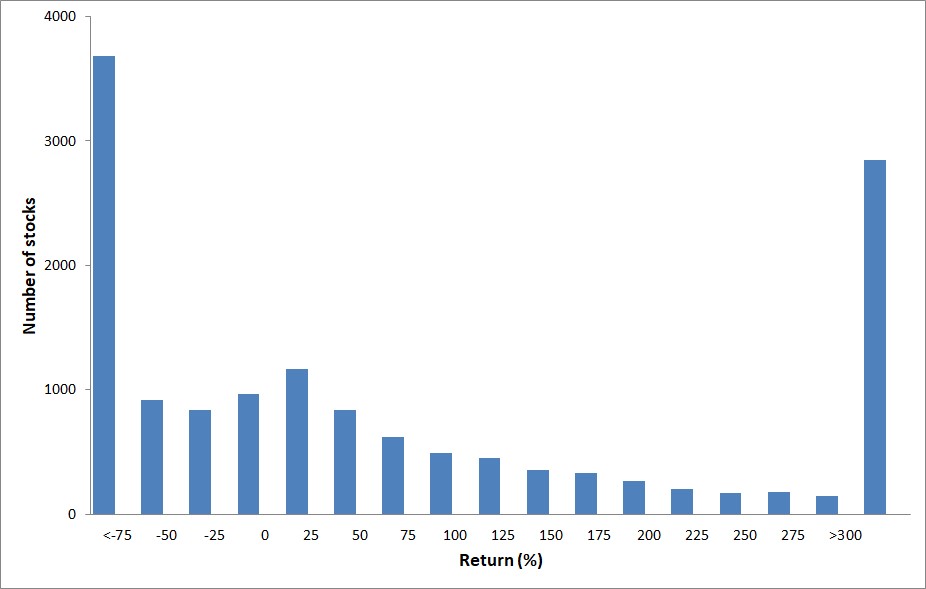
So, let’s instead look at a distribution of lifetime returns for individual stocks (which does not allow stocks to enter or leave the scope of consideration). This lifetime returns for individual stocks is shown in Figure 2 for the holding period of 1989 – 2015 (26 years) (link to the data used to make this chart is here). The percentage of winners is 55.7% (p=0.557). The average growth is 173% for winners while the average shrinkage is -66% for losers, giving b = 173%/66% = 2.61. The Kelly bet is f = 0.557 – (1-0.557)/2.61 = 0.388 or 38.8% maximum allocation to any one stock. Using the ½ Kelly bet, we get a maximum allocation to any one stock of 19.4%.
We get a very similar prediction of maximum allocation to any one stock of around 20% when using the ½ Kelly bet, and figuring the holding period for short time periods (1 year) and long time periods (26 years). Further, we considered large stocks for the case of the S&P500 and a short holding period, but we considered all sizes of stocks for the case of longer term returns (keep in mind that small/microcap stocks have a disproportionate number of poor performers as can be seen from the data at this link showing all stock data for all 8000 individual stocks compared with the individual S&P500 stocks here).
This maximum allocation of 20% is for the ideal stock. That is, a stock which you have very high conviction on and assess as very low risk. If you bet on an industry instead of an individual stock, you may diversify away more (but not all) of the idiosyncratic risk and so you could consider bets closer to this maximum for industries vs. individual stocks. For stocks that have what you assess to be substantial company specific risks or industry specific risks, you should reduce your maximum allocation accordingly. Put another way, this suggests that you should hold, at a bare minimum, at least 5 stocks equally allocated.
The Kelly criterion provides useful guidelines, but has many assumptions that are difficult to satisfy in the real world, so should be taken as just that – a guideline, not an iron law. It is meant more to keep you in a safe regime of allocations, not as a justification to allocate too much to a particular security. In addition you will face many practical difficulties as you implement your portfolio allocations that will require judgment calls. Here are a few examples:
- As you invest over your lifetime and assuming you practice buy and hold investing, a large proportion of your holdings might be invested in already held stocks. Purchases of new stocks may then only achieve tiny allocations relative to previous holdings, unless you keep pouring new funds and dividends into these new stocks for a substantial period of time. If you have a high conviction, once in a lifetime opportunity, do you sell previously held assets and incur taxes or do you hold fast to a buy and hold mentality?
- As you buy and hold over many decades you will naturally collect more and more holdings as different companies on your star list become cheap and then get added to your portfolio. How do you maintain a portfolio target of 10 stocks (or whatever number)? Do you trim holdings in old stocks to make way for new holdings?
- As you invest over your lifetime and assuming you practice buy and hold investing, you may find that just 1, 2 or 3 holdings greatly outperform the rest of your portfolio. It is even likely that, over time, these few stocks will compose a substantial fraction of your portfolio – much greater than the maximum allocation of 20% suggested by the Kelly criterion. Do you sell your winners when they grow to greater than 20% allocation, thus limiting your risk, but also limiting your growth? One of the tenets espoused by many superinvestors is to buy and hold no matter what, and to let your winners ride (Peter Lynch often said this). Many superinvestors are concentrated into a few high conviction stocks that did extremely well. Was some of this attributable to survivors bias? (i.e., we only here about the successful investors that were concentrated and won, but not those who lost using the same principle of concentration who simply got unlucky)
These and other tough decisions will confront you as a successful buy and hold investor in the future. Allow me to provide a few clues for how to handle these situations by telling you what I do in my own portfolio:
- I generally allocate 5-10% to a stock that is a really great deal. I may also start with smaller amounts and increase purchases as the stock falls if just a good deal. For a great stock, risk decreases as price falls, not increases as most people believe (note this is the case for a well-vetted company that has been judged to be outstanding, not a value trap that you just invest in because it is “cheap”). So you can start with a smaller allocation and increase as price continues to fall. These allocations also give the stock room to grow into a higher allocation if it grows faster than the rest of my portfolio.
- A 20% allocation to a stock at the time of the initial purchase or set of purchases would be reserved for a once in a generation type of deal on a fantastic, high quality company (think Coke at a price to free cash flow of 12).
- As much as possible, when building a new holding to the desired allocation, I try to avoid selling current holdings and instead try to buy using new funds plus dividends. This can take time to build to the target allocation, and sometimes time-limited situations develop, necessitating raising funds by selling. But often, the company can be overlooked for a few years before getting positive attention, giving me time to build a position.
- For dividends, I don’t necessarily reinvest into the company that paid them. Instead, I allocate new dividends to the best current deals on my Star List. This allows me to grow allocations in other desirable stocks while not quickly over-allocating to just a few companies that happen to pay high dividends.
- I don’t worry too much about having too few stocks. As long as I have at least 6-7 or more in my portfolio, and they are the highest quality companies I can find across a few different industries, I am fine. I also don’t try to pack in too many. I don’t set out to stuff my portfolio with 50 companies. I don’t want to engage in diworsification, so I don’t put things in my portfolio that don’t meet my highest quality standards, especially not just for the sake of having more different kinds of stocks in my portfolio.
- By the same token, I don’t worry about having too many stocks either. Over time, my portfolio naturally accumulates more different kinds of stocks because different stocks go on sale each year, decade, etc. I practice buy and hold, so I don’t sell unless there is a very good reason, such as deteriorating business fundamentals, a once in a generation opportunity that I need to deploy more capital towards right now, or a valuation that is so ridiculous that continuing to hold makes no sense. I don’t want to incur the realized capital gains taxes, and other pitfalls associated with selling too frequently that were discussed previously. I don’t sell stocks simply because I want some target number in my portfolio. The goal is always high quality and value at the time of purchase.
- Over time, winners will grow faster than average holdings. I usually don’t try to trim my winners, but instead let them grow unimpeded. However, if a company is growing so much relative to the rest of the portfolio that it becomes 40-50% of my holdings, I will probably be forced to trim it somewhat to hold it at or below that allocation. I am willing to let it grow to a full Kelly bet because, by definition, it is performing well. I would probably start monitoring this holding more closely for any problems, however. This also depends on the company, and its characteristics and risks, as well as how it fits with the rest of the companies in my portfolio and how they may or may not produce offsetting or enhanced risks together. Remember, when looking at diversification, it is not as simple as picking companies in different industries. Different companies can have correlated risks other than industry, like common geographic location of factories, operation in particular countries, a secondary industry that affects both, etc. You need to consider these factors as a part of diversification.
Hopefully this helps you to determine allocations of individual stocks and stock indices in your own portfolio, and gives you a few rules of thumb based on a foundation of mathematical reasoning to guide you.
Leave a Reply to Davis2868 Cancel reply